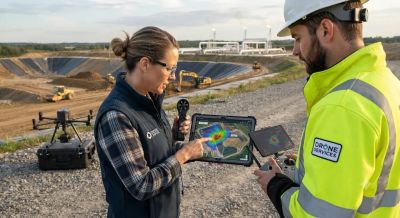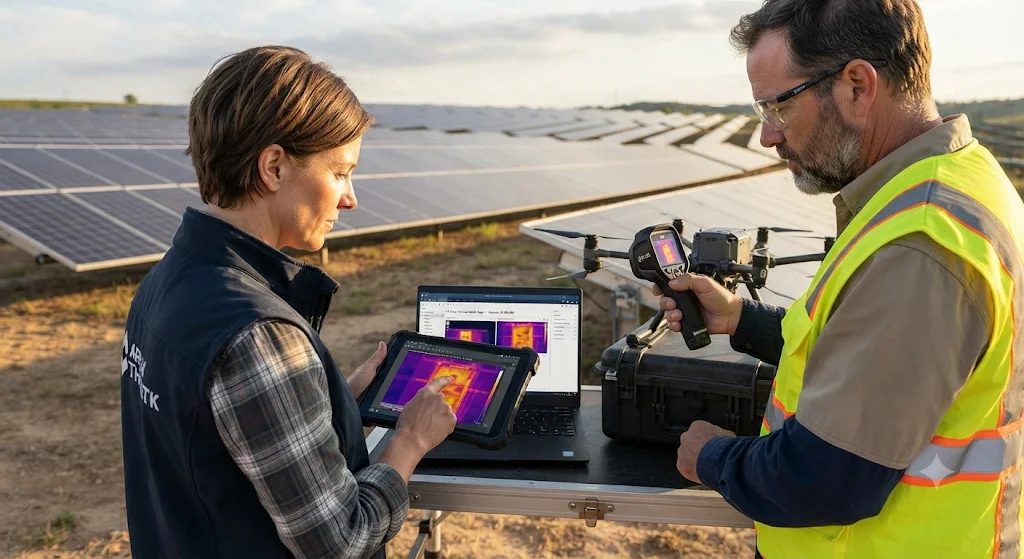
Manual inspections of utility-scale solar farms are slow, expensive, and often miss early-stage failures hidden deep within rows of modules. Drone thermography turns a huge solar field into a quick data capture job by flying special aerial cameras above the array. It turns invisible heat into useful information, so failing parts can be found before they hurt energy production or safety. How well it works depends on sensor calibration, flight geometry, ground validation and following the rules for flying.
How Radiometric Thermal Sensors Detect Cell Defects
A healthy solar panel turns most of the light it receives into electricity, and only a small share is lost as heat. When something goes wrong, like a cracked cell, an internal cell failure or a faulty bypass diode, the electrical resistance goes up in that spot. This creates a thermal anomaly, often called a hot spot, which gives off much more heat than the cells around it. Calibrated Long-Wave Infrared (LWIR) sensors working in the 7.5 to 14 micrometer band pick up this heat and show it as bright yellow, orange or white patches against cooler blue or purple modules that are working fine.
Using calibrated 640×512 radiometric sensors with a thermal sensitivity (NETD) below 50 mK is a big engineering tradeoff compared to cheaper, visual-only cameras. Radiometric payloads cost more and create large 16-bit R-JPEG files, but they store an exact temperature value in every pixel instead of just a relative color map. Technicians also set the camera emissivity to around 0.85 to 0.90 for tempered solar glass so the surface temperature readings aren't skewed. Under the fault classification rules in IEC TS 62446-3, a uniform warm substring or a single hot cell often points to a bypass diode problem, while smaller, localized spots usually mean micro-cracks or cell damage.
Flight Geometry and Data Processing Parameters
To get thermal signatures that can be repeated, flight planning and photogrammetric processing have to follow strict parameters. Pilots program automated grid missions with at least 75 percent front and side image overlap, a ground sampling distance under 3 centimeters per pixel, and near-nadir viewing angles between 5 and 15 degrees off vertical so the sensor doesn't see its own reflection. Dual-sensor payloads take paired thermal and high-resolution RGB frames with RTK or PPK geotagging, so maintenance teams can find a faulty panel down to the exact row and rack. Photogrammetry workstations then stitch hundreds of overlapping frames into one geo-referenced orthomosaic map. This costs more GPU computing time, but in return the whole plant gets automated fault reports.
Distinguishing Genuine Faults from Misleading Readings
Not every bright spot on a thermal map means a module has failed. Experienced technicians have to carefully check the raw aerial data to avoid costly false positives and wasted maintenance trips. Reflection from the environment is the most common cause of misleading readings, because solar glass can mirror the sun or nearby metal structures straight into the sensor. Technicians check suspected anomalies by changing the drone's viewing angle during flight or by inspecting the module from the ground.
Weather also changes the thermal contrast. Strong wind cools the panel surface and hides real faults, while heavy dirt or bird droppings trap heat under the glass and look like internal defects. Visual-spectrum RGB images help technicians filter out surface debris. Following the testing thresholds in IEC TS 62446-3 and the thermal calibration practices from ASTM International, operators fly only when the irradiance is steady above 600 W/m², so internal failures show clear thermal contrast.
Meeting Aviation and Site Safety Requirements
Before flying over a commercial solar array, pilots must hold valid remote pilot credentials, such as FAA Part 107 certification in the United States or Digital Sky authorization in India, and get local airspace clearance. Operators also have to work with plant managers to follow site lockout rules, keep a safe distance from high-voltage inverters and overhead power lines, and maintain visual line of sight during the whole mission.